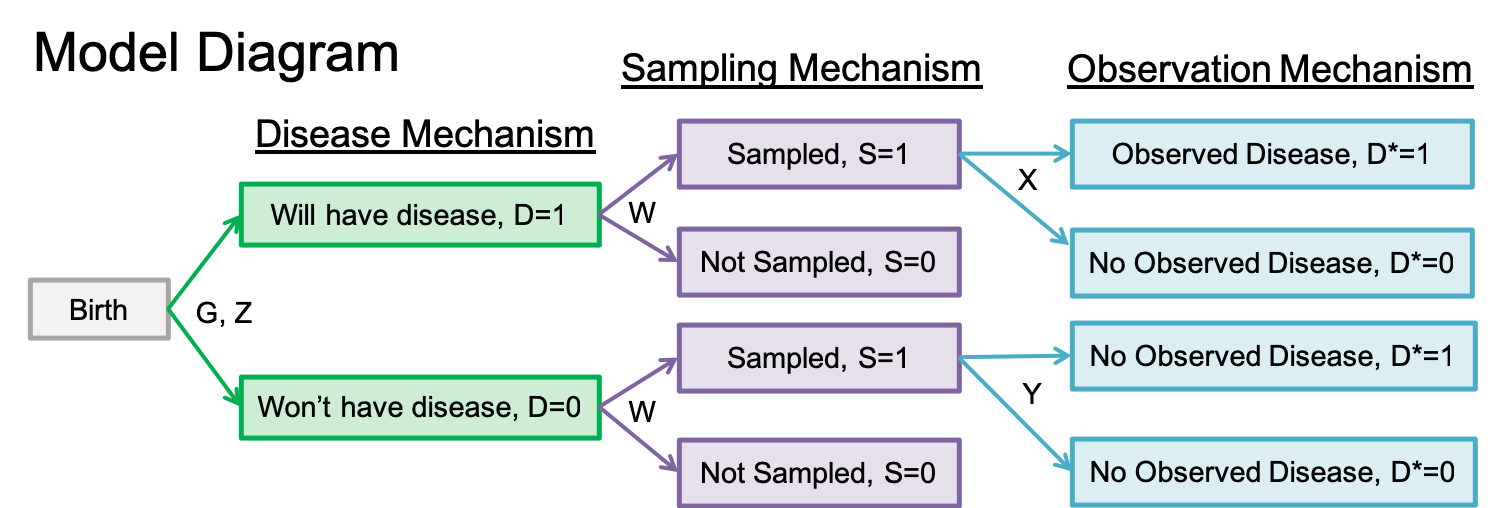
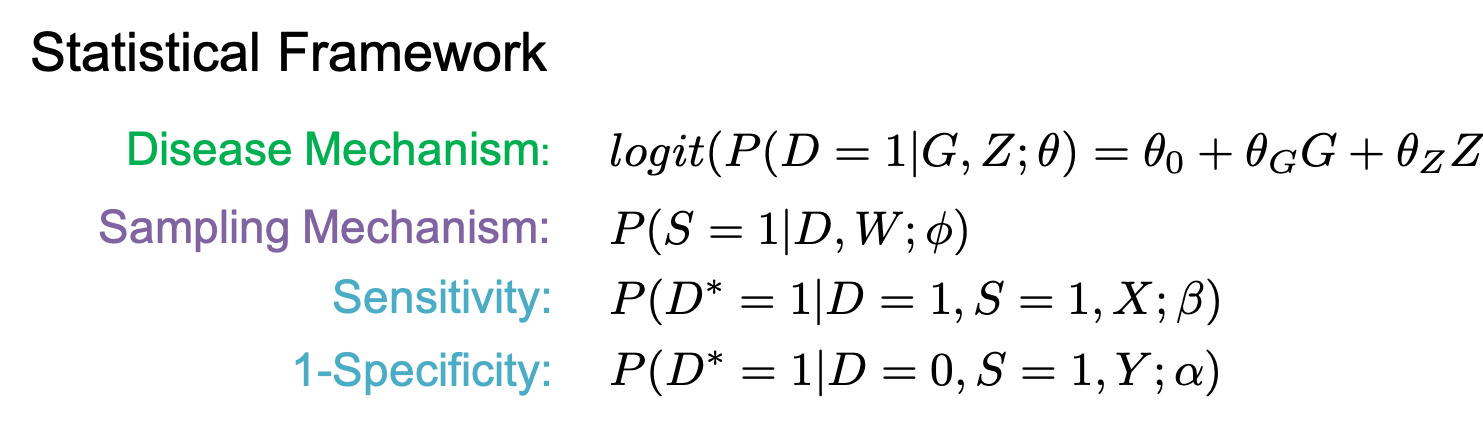
ASSUMPTIONS FOR ANALYSIS MODEL:
 	 (a) Covariates in Z are centered to have mean 0. PRS centered to have mean zero.
 	 (b) X, Y, and W are independent given G, Z, D, and S=1.
 	 (c) X and Y are independent of G given Z, D, and S=1.
 	 (d) W is independent of G given Z and D. Not needed if W is in Z.
Developed by Dr. Lauren J Beesley, Department of Biostatistics, University of Michigan
Contact: lbeesley@umich.edu
These plots provide expressions for the bias in estimating the effect of G and the intercept when we fit a simple logistic regression model for D*|G,Z,S=1 in our sampled dataset. We assume that the data follow the proposed model.
NOTE: If help information does not appear when you hover over the question marks, try reloading the page.
Developed by Dr. Lauren J Beesley, Department of Biostatistics, University of Michigan. Contact: lbeesley@umich.edu
NOTE: If help information does not appear when you hover over the question marks, try reloading the page.
Developed by Dr. Lauren J Beesley, Department of Biostatistics, University of Michigan. Contact: lbeesley@umich.edu
This plot provides predictions for the value of theta_G given (1) P(D=1|G=0, Z=0) or P(D=1) and (2) the log-OR effect of G obtained from a logistic regression fit for D*|G,Z,S=1 on the sampled dataset. Predictions are plotted for sampling ratios in the specified range and for sensitivity from 0.1 to 1.
NOTE: Some combinations of parameters result in no solution to the equation used to solve for the predictions. These combinations are not plotted. Therefore, some extreme parameter values will result in no valid prediction for any values of the sampling fraction within the range provided for a particular sensitivity level.
NOTE: If help information does not appear when you hover over the question marks, try reloading the page.
Developed by Dr. Lauren J Beesley, Department of Biostatistics, University of Michigan. Contact: lbeesley@umich.edu